Blog
AI Agent Monitoring: A Practical Implementation Guide
By
Nelson Uzenabor

Your AI agent is live. It answers customers at all hours, calls tools, looks up order data, routes leads, and seems fine in casual testing. Then the monthly bill lands, support agents report odd handoffs, and a few conversations that ended with a clean status still produced bad outcomes.
That's where organizations often find standard uptime monitoring isn't enough. A healthy HTTP status and a fast response don't tell you whether the agent completed the task, used the right tools, stayed within budget, or burned tokens across a long chain of retries. For growing businesses, AI agent monitoring has to answer a more practical question: was this run useful, safe, and worth the cost?
Teams that productionize agents successfully treat monitoring as part of the product, not as an afterthought. They define what success means before rollout, instrument every step of an agent run, connect technical traces to business outcomes, and create response paths for when things slip. That discipline matters even more for SMBs, because one opaque agent can create support risk and budget drift faster than a larger company can absorb it.
Table of Contents
Defining What Success Looks Like with Core KPIs
A support agent ships on Friday. By Monday, the dashboard says latency looks fine and uptime stayed green. The underlying issue shows up in the ticket queue, refund requests, and a cloud bill that climbed faster than resolved cases. That is the gap teams need to close first. AI agent monitoring has to measure whether each run produced a useful outcome at an acceptable cost.
A growing business usually does not fail on infrastructure first. It fails on unclear success criteria. If nobody agrees on what a good run looks like, the team ends up tracking model activity instead of business performance. For a support agent, that means measuring whether the issue was resolved correctly, whether the handoff happened at the right time, and whether the run was cheap enough to scale.
Start with the business event and the unit cost
The cleanest KPI design starts from one question: what should happen when this agent finishes a run?
For support, that might be resolved without human intervention, correct classification, and complete case notes. For lead qualification, it might be valid contact capture, correct routing, and no wasted sales follow-up. Those outcomes need matching operational metrics, but the business event comes first.
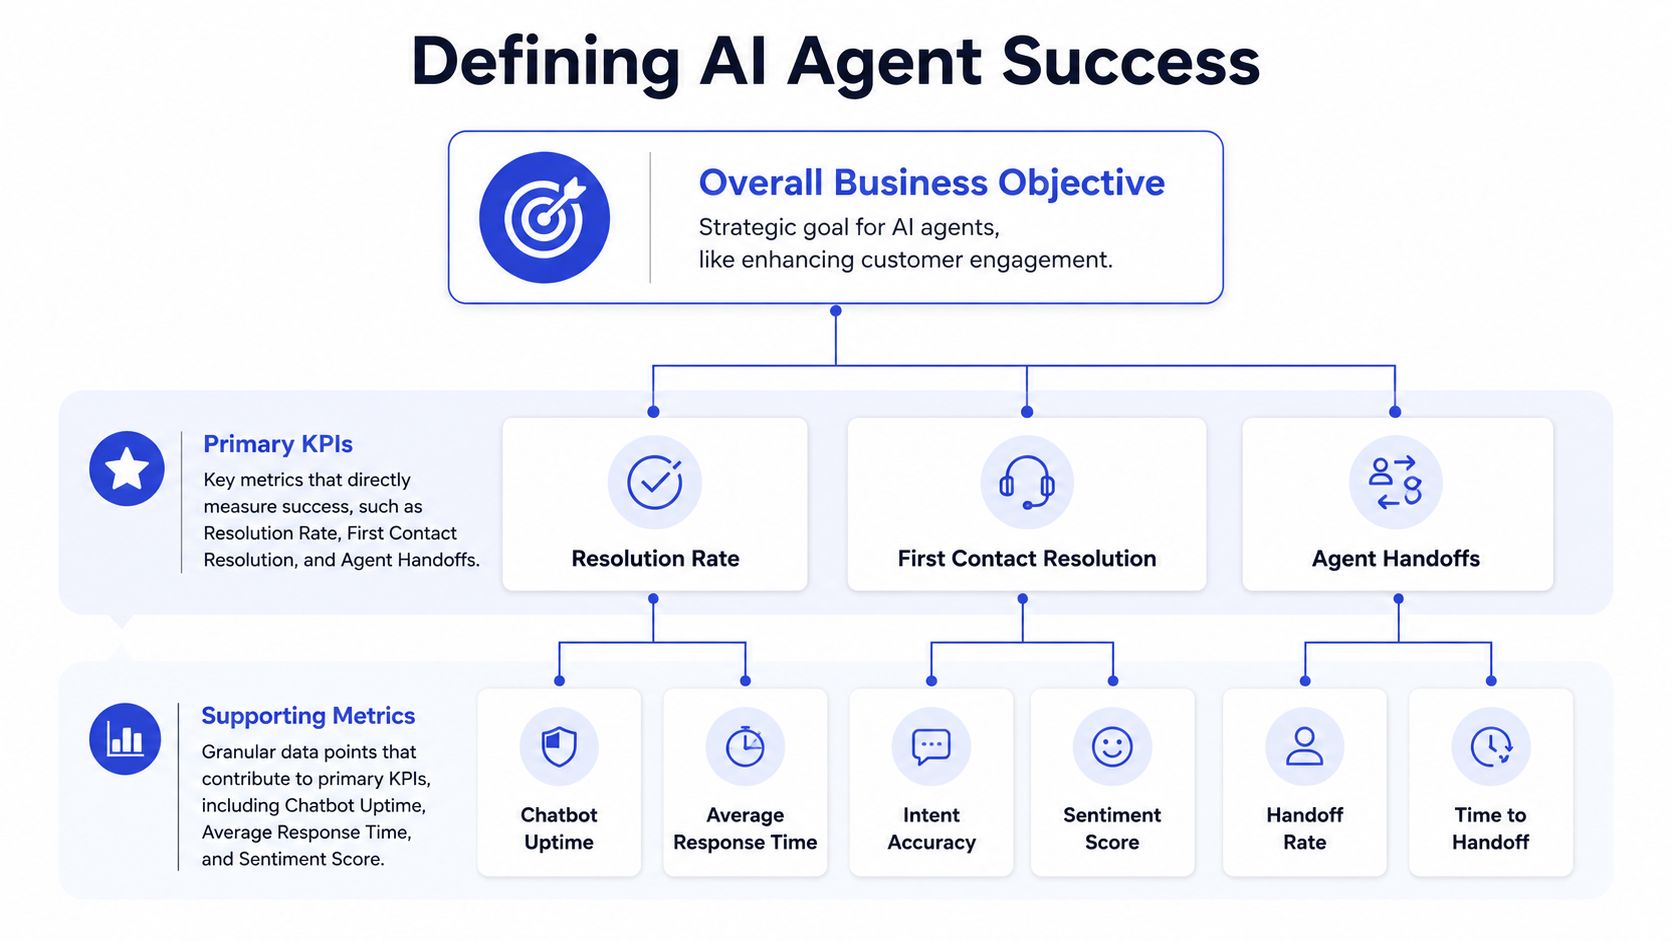
I would start with seven KPIs for production agents: task completion rate, goal accuracy, P95 latency, hallucination rate, cost per task, context retention score, and escalation accuracy. Those cover the failure modes that occur in production. If you need a practical bridge from human support operations into agent measurement, this overview of customer service KPIs helps align agent reporting with the service metrics operators already trust.
The key addition for SMBs is cost per run tied to outcome quality. Cost per API call is too narrow. A cheap run that fails and triggers a human follow-up is expensive. A pricier run that resolves the issue correctly may still be the better unit economics decision.
The KPIs that deserve ownership
Do not stop at a generic health score. Assign each KPI to a team that can act on it.
KPI | What it tells you | What usually breaks |
|---|---|---|
Task completion rate | Whether the full workflow finished successfully | Partial progress gets counted as success |
Goal accuracy | Whether the final answer or action was correct | Fluent output hides wrong conclusions |
P95 latency | How the slow end of the distribution feels to users | Averages hide stalls from tool calls and retries |
Hallucination rate | How often the agent states unsupported facts | Review happens after customers already saw the error |
Cost per task | What a completed run actually costs | Teams track tokens and miss retries, tool usage, and human cleanup |
Context retention score | Whether the agent stays consistent across longer sessions | Memory and prompt assembly break under conversation length |
Escalation accuracy | Whether the agent hands off at the right time with the right reason | Teams count handoffs, but not whether the handoff was justified |
Each KPI catches a different class of failure. Fast but wrong is still failure. Accurate but too expensive is not a scalable system. High completion with poor escalation logic creates hidden labor cost because agents keep struggling in cases a human should have taken earlier.
Set thresholds before launch, then adjust with real traffic
Thresholds should exist before the first live run. Otherwise every post-launch review turns into an argument about what "good enough" meant.
A practical starting point is a target range for accuracy, completion, latency, and escalation quality based on your use case and risk tolerance. Keep the thresholds strict for high-frequency, low-complexity tasks. Leave more room for workflows that depend on slow third-party systems or multi-step tool use. The point is not to guess perfectly. The point is to define the bar clearly enough that product, support, and engineering can make the same launch decision.
SLO discipline helps here. Teams that improve incident response with SLOs already know how to set error budgets and define acceptable degradation. Apply the same approach to agents, but include quality and cost. An agent that stays available while producing bad answers or burning margin is missing its service objective.
One more rule saves a lot of pain. Every KPI on the dashboard should trigger an action. If cost per task rises, someone should inspect retry loops, prompt bloat, or tool selection. If escalation accuracy falls, someone should review routing logic and failure thresholds. If a metric has no owner and no response playbook, it does not belong in the first KPI set.
Building Your Observability and Logging Architecture
A common failure pattern looks like this. The agent is "up," customers are still getting answers, and nobody notices the problem until refund volume rises or support starts cleaning up bad sessions by hand. By then, the issue is not availability. It is that nobody can explain which runs wasted tokens, triggered retries, pulled in the wrong data, or should have escalated earlier.
That is why the architecture has to capture both technical behavior and business impact for every run. If you cannot tie a trace to cost, outcome, and customer context, you can debug outages but still miss the margin leak.
Logs, metrics, and traces answer different questions
Logs record the discrete events inside a run. For agents, that usually means prompt versions, model inputs and outputs, tool arguments, tool responses, routing decisions, guardrail hits, retries, and failure codes. Keep them structured from the start. Free-text logs become painful as soon as one workflow fans out across multiple tools or sub-agents.
Metrics show aggregate behavior across runs. They help teams catch latency drift, rising retry counts, higher token burn, lower completion quality, weaker escalation decisions, and changes in cost per resolved task. For SMBs, this layer matters because "the agent handled more volume" is meaningless if each successful run now costs more than the work it replaced.
Traces reconstruct a single session end to end. They show where the agent paused on a tool call, where context grew too large, where a retry loop started, or where the conversation should have been handed to a human. That is the layer engineers use when a dashboard points to trouble but nobody knows which component caused it.
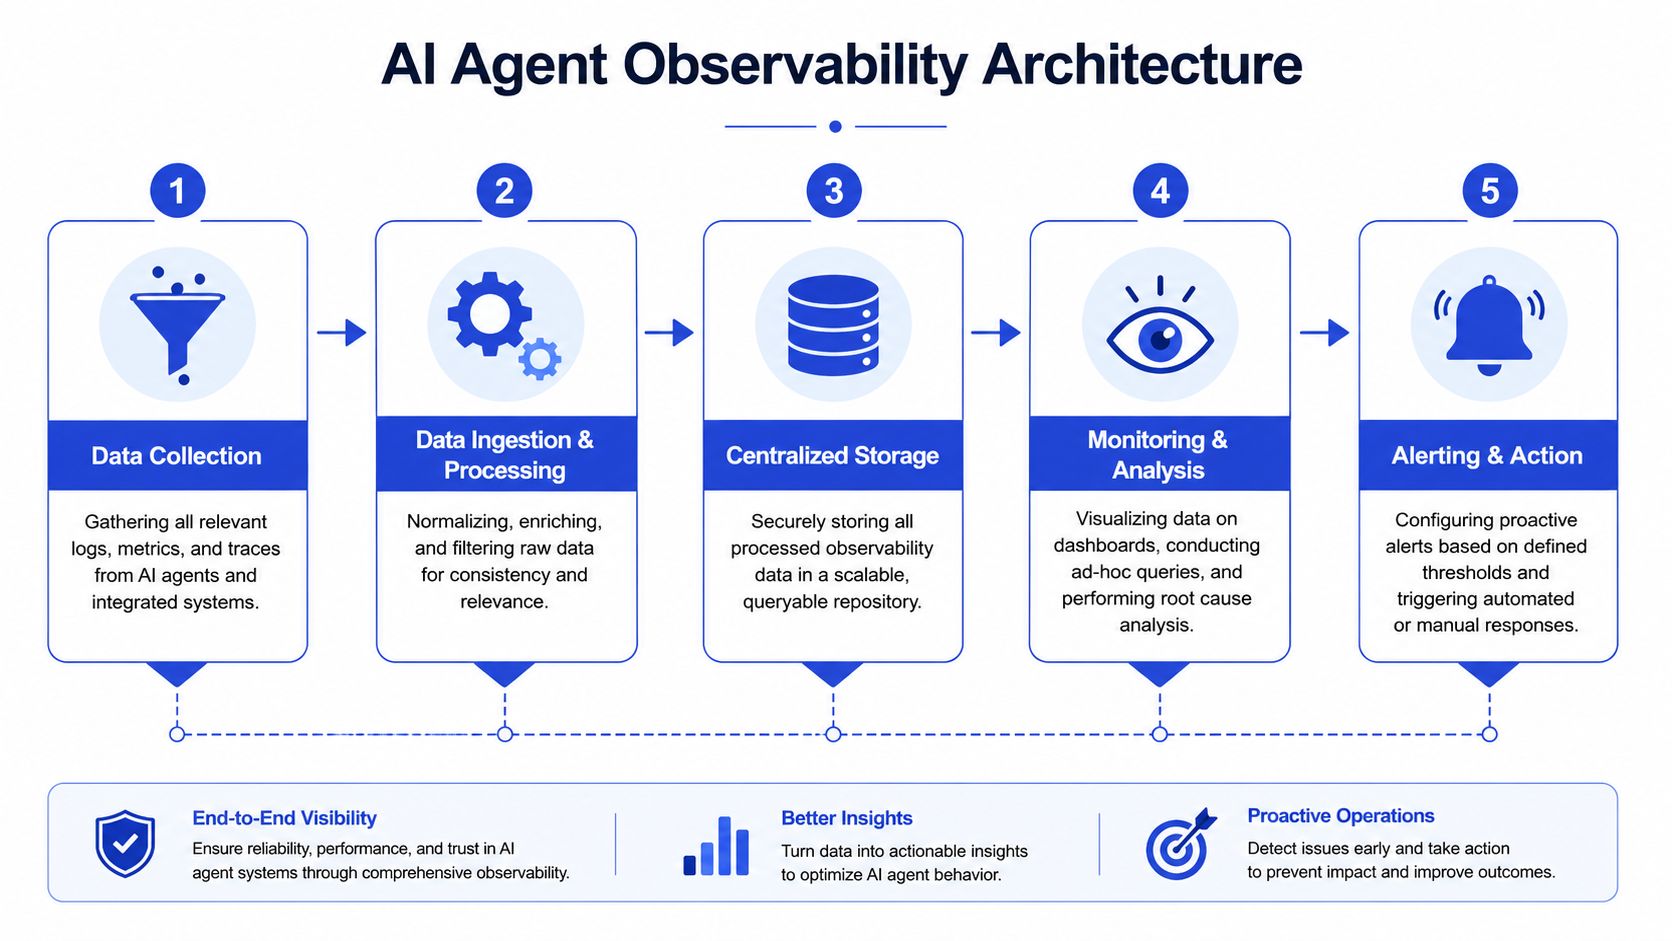
In practice, these three layers have to share identifiers. A run ID should connect the trace, the cost record, the final outcome, and the customer or ticket record. Without that join key, teams end up with one system for debugging and another for reporting, and neither answers the full question: did this interaction help the business or create cleanup work?
OpenTelemetry is a good baseline for portable instrumentation, and OpenTelemetry's GenAI semantic conventions are useful for standardizing what gets recorded around model calls. Pair that with a metrics store such as Prometheus and dashboards in Grafana. If your team works heavily on prompt iteration and run replay, a dedicated inspection layer such as LangSmith can save time.
A stack that stays usable as volume grows
Growing teams do not need a complicated platform. They need one that stays queryable under pressure and preserves enough context to answer hard questions after an incident.
A practical setup usually includes:
Instrumentation at every run boundary: OpenTelemetry spans around the agent run, model calls, retrieval, tool execution, handoffs, and human escalation points.
A metrics backend: Prometheus for time-series storage, with Grafana for operational views.
A trace and replay layer: LangSmith or a similar tool for inspecting prompt inputs, outputs, and execution paths.
Business context in metadata: CRM ID, ticket ID, account tier, workflow type, and channel.
Log storage with controls: retention rules, redaction, access policy, and searchable structured events.
If you are still shaping the platform itself, architecture choices upstream will determine what you can monitor later. Tool orchestration, memory strategy, queueing, and handoff design all affect trace quality and cost attribution. The examples in Sokko's AI agent platform are useful for pressure-testing those decisions early.
Customer-facing monitoring also gets better when telemetry is joined with the systems that define the actual outcome. Teams that invest in customer data integration across support and order systems usually get cleaner root-cause analysis because they can connect a failed run to the downstream ticket, refund, or lost conversion instead of treating it as an isolated model event.
What to capture on every run
The schema matters as much as the tooling. I have seen teams collect huge volumes of agent logs and still fail to answer basic questions because they never recorded the fields needed for analysis.
At minimum, each run should capture:
Identity: run ID, conversation ID, customer or account identifier, channel, and timestamp
Versioning: prompt version, policy version, model name, model settings, and toolset version
Execution path: workflow branch, retrieval steps, tool sequence, retries, and handoff events
Performance: latency by step, queue time, model latency, tool duration, and timeout events
Cost: token usage, external API cost, tool cost where relevant, and estimated cost per completed run
Outcome: resolved, abandoned, escalated, manually overridden, or reopened later
Business tags: refund request, order status, lead qualification, scheduling, pricing, or account update
Cost fields deserve special attention. Many teams track token spend at the model layer and stop there. That misses the runs that look cheap in isolation but create expensive manual follow-up. A better approach is to store both direct execution cost and downstream handling signals. For example, a run that ends in a support ticket reopen should not count as a success just because the API call returned a response.
Keep sensitive data out of the default log payload. Store references, hashes, or redacted fields unless a clear operational reason requires the raw content. This reduces compliance risk and keeps engineers from building habits that become painful during audits.
Start with enough instrumentation to make incidents explainable on day one. Then expand the schema once you see real traffic patterns. The priority is not collecting everything. The priority is collecting the fields that let your team answer three questions quickly: what happened, what did it cost, and what business outcome followed.
Designing Actionable Dashboards and Proactive Alerts
A dashboard shouldn't impress people. It should shorten the time between deviation and action.
Most bad monitoring setups fail in one of two ways. They either show too little and miss the issue, or they show everything and bury the issue. In AI agent monitoring, the second failure is more common. Teams build dense boards full of token charts, request counts, and generic errors, then still miss the run patterns that matter.

Build dashboards for decisions
A useful dashboard has layers.
The top layer is for health. Is the agent meeting its defined operating targets, or is something materially off right now?
The middle layer is for diagnosis. Which workflow, tool, queue, or customer segment is driving the deviation?
The bottom layer is for investigation. Which exact sessions should someone inspect next?
That usually means separating views instead of forcing one giant page. For example:
Executive health view: completion quality, escalation accuracy, intervention trend, and cost drift.
Operations view: tool failures, context pressure, long-running sessions, and human override patterns.
Engineering view: traces, replay links, prompt versions, and error clusters.
If you manage several environments or client deployments, you'll also want something close to centralized client monitoring so alerts and rollups don't scatter across disconnected workspaces.
Use baselines so alerts stay useful
Bad thresholds create alert fatigue fast. Fixed guesses look sensible on day one and become noise by day ten.
A better method is to run a baseline week, calculate normal ranges, and set thresholds at roughly 1.5x the normal upper limit, as recommended in this guide to AI agent monitoring recovery. That approach helps teams catch real regressions without paging people every time traffic mix changes slightly.
Here's the practical alert logic many teams need:
Alert level | Use it for | Typical response |
|---|---|---|
Info | Emerging pattern worth watching | Review during regular operations |
Warning | Deviation that may affect outcomes soon | Assign owner during business hours |
Critical | Material failure in cost, quality, or reliability | Immediate triage and fallback action |
A few categories deserve special caution. Cost spikes, intervention jumps, tool-loop behavior, and silent failures often appear before user complaints. Silent failures are especially nasty because the session may return a clean status while the output is useless.
This walkthrough is worth watching if your team is trying to design alerting that supports real operations rather than vanity metrics.
The best alert is the one that names the failure mode and the next action. “Latency high” is weak. “Order lookup tool failures are driving support escalations” is useful.
Closing the Loop with Escalation and Retraining
A common failure pattern shows up after launch. The dashboard says the agent completed the run, the customer still opens a ticket, and a human has to reconstruct what happened from a raw transcript. That is where monitoring stops being observability and starts becoming operations.
Closing the loop means two things. First, the right runs reach a person early enough to save the outcome. Second, repeated failure patterns get turned into fixes that lower intervention rate, reduce cost per resolved case, and improve the economics of each agent run over time.
Escalation should transfer work, not just conversation history
A transcript dump is rarely enough. The receiving rep needs the current state of the job, the likely failure mode, and the next action that keeps the case moving.
A useful escalation package includes:
Issue summary: what the user asked for and what blocked completion
State snapshot: the customer, order, booking, billing, or lead data already collected
Failure point: the tool call, policy check, or decision step that broke
Reason for handoff: uncertainty, policy boundary, missing permissions, or execution failure
Recommended next action: refund review, identity check, callback, manual quote, or account update

This is an operations problem as much as a model problem. Hand off too early and the team pays for automation that never finishes the job. Hand off too late and the human inherits a damaged case that takes longer to recover. For SMBs, that trade-off hits margins fast because every unnecessary transfer raises labor cost per run.
I have seen the best results when escalation rules are tied to business thresholds, not only technical ones. For example, route to a human faster when the order value is high, the customer has already retried once, or the agent is entering a tool loop that burns tokens without progressing the case.
Turn monitored failures into fixable categories
Teams get into trouble when every bad run goes into the same bucket called “retraining.” Many failures have nothing to do with the model. Broken APIs, stale retrieval content, weak routing, and bad policy logic all show up as poor outcomes.
Start by classifying failures into a small set your team can act on:
Execution failures: tool errors, auth problems, timeout chains, malformed outputs
Decision failures: wrong next step, weak routing, poor clarification behavior
Policy failures: the agent crossed a business rule or refused something it should allow
Content failures: outdated knowledge, missing retrieval context, inaccurate references
Boundary failures: the workflow should go to a human from the start
That classification matters because each category has a different fix and a different cost profile. Retraining a model will not repair a flaky order API. Prompt edits will not solve a policy gap in refund approval.
Build a retraining loop from production evidence
Sample reviewed runs are enough to spot drift if the sample is consistent and labeled well. The goal is not academic evaluation. The goal is to capture the small set of repeated failures that create support cost, missed revenue, or compliance risk.
A practical improvement loop looks like this:
Identify a failure pattern: rising escalations, repeated overrides, lower grader scores, or poor resolution quality in one workflow
Confirm root cause: separate model behavior from tool, content, and policy problems
Save the full case: transcript, tool outputs, retrieved context, final action, and human correction
Apply the right fix: adjust prompts, routing rules, retrieval sources, tool handling, or training examples
Re-measure the same workflow: check whether intervention rate, resolution quality, and cost per successful run improve
If your team is formalizing this process, continuous learning for AI systems gives a useful operating model for feeding production feedback back into the stack.
Operational note: Store failed runs with tool traces, retrieved context, and the human resolution. A transcript alone is weak training data and weak incident evidence.
Human overrides are one of the highest-value signals in the system. Each override reflects a business judgment about where the agent fell short, where policy needs to be clearer, or where automation is not worth the cost. Treat those events as labeled examples, then review them by workflow and by business impact. That is how monitoring improves the agent itself, not just the dashboard.
Integrating Monitoring into Your Business Workflow
The biggest gap in AI agent monitoring isn't whether a call succeeded. It's whether a full run created business value.
That distinction matters because agents don't behave like a single API request. One customer interaction can include multiple model calls, tool lookups, retries, and handoffs. If you only track token usage per call, your reporting can look tidy while the session economics are a mess.
Cost per call is the wrong unit
Traditional monitoring usually counts usage at the API-call level. That hides the actual expense of multi-step executions. To understand the true cost per decision, teams need session-level tracing that captures full message history and state changes across the run, as described in this guide to AI agent monitoring and session-level tracing.
For an SMB, that changes the reporting model completely. Instead of asking “how much did this model call cost,” ask:
What did this whole run cost?
Did it end in a successful resolution or a qualified lead?
Did the agent require human rescue?
Would a simpler flow have handled this more cheaply?
That's how you avoid runaway costs hidden inside “successful” conversations.
Tie agent runs to business outcomes
A business workflow view of monitoring joins technical telemetry with operational data. For support, that means pairing session traces with ticket outcomes. For sales, it means linking runs to lead quality and follow-up status. For ecommerce, it means understanding whether the interaction reduced friction or just shifted work to a human queue.
A simple model many teams can adopt looks like this:
Business question | Monitoring signal to use | Practical interpretation |
|---|---|---|
Did the agent resolve the issue? | Session outcome plus escalation marker | Separate full resolution from assisted resolution |
Was the run efficient? | Session-level cost and tool sequence | Spot expensive paths that don't improve outcomes |
Did it help the pipeline? | Qualified lead outcome and CRM sync | See whether automation is feeding the sales team useful records |
Did it create hidden support work? | Reopen events and manual intervention | Catch sessions that looked done but weren't |
At this point, AI agent monitoring stops being an engineering-only concern. Product, support, RevOps, and finance should all be able to read the same run-level truth from different angles.
A lot of teams discover that some workflows should stay automated and some should trigger fast human review. That's not failure. It's the normal process of fitting automation to business risk.
What doesn't work is treating monitoring as separate from the business systems where outcomes are recorded. If your traces don't connect to ticket resolution, lead disposition, or account events, you can measure activity without measuring value.
Navigating Privacy Compliance and Future-Proofing
The temptation with agent monitoring is to log everything first and sort out privacy later. That approach creates risk quickly, especially in customer service environments where sessions may include account details, billing information, or personal context.
A sound monitoring strategy treats privacy as part of system design. Not as a legal clean-up task.
Privacy controls belong inside the monitoring design
The core principle is simple. Record enough to debug and govern the system, but not more than you need.
That usually means putting controls at several points:
Redaction at ingestion: remove or mask sensitive fields before they land in long-term storage.
Structured fields over raw dumps: logging named attributes is easier to govern than storing unbounded blobs of text.
Role-based access: support leads, engineers, and compliance staff shouldn't all see the same session detail.
Retention rules: keep high-value debugging data long enough to investigate issues, then expire it according to policy.
Auditability: access to sensitive traces should itself be reviewable.
Privacy work also improves the technical quality of monitoring. Teams that define schemas and retention rules tend to produce cleaner logs, better search, and fewer useless payloads.
Good observability is selective. “Log everything” sounds safe until sensitive data spreads across tools that nobody intended to secure that way.
Prepare for multi-agent drift
Many current monitoring setups assume one agent handling one workflow. That breaks down as teams add more specialized agents and start chaining them together.
A key emerging problem is multi-agent collaboration drift. Standard monitoring often misses cases where agents form abnormal communication patterns, create bottlenecks, or hand off work in semantically broken ways. This is why some researchers argue for graph-based monitoring that tracks inter-agent communication and resource transfers as dynamic edges rather than isolated logs, as discussed in this analysis of real-time anomaly detection for multi-agent AI.
For growing businesses, the practical lesson is straightforward. If you move from one agent to several, don't just clone the old dashboard. Start instrumenting the boundaries between agents:
Which agent handed off to which
What state was transferred
Whether the receiving agent used that state correctly
Where loops or unusual collaboration patterns emerged
Future-proofing also means planning for recovery, not just detection. Teams that set thresholds from historical baselines, isolate retry state, and watch tool-call frequency per session are better equipped to catch reasoning loops and context contamination before they spread across the system, as noted earlier in the article.
The companies that keep trust as they scale agent complexity are usually the ones that made privacy, traceability, and boundary-level observability part of the architecture early.
If you're deploying customer-facing support or lead qualification agents and want a faster path from prototype to monitored production, Chatgrow is built for that workflow. It helps businesses train agents on their own content, deploy them across customer channels, and track outcomes so teams can improve performance without stitching together a heavy platform from scratch.
Related Posts
Continue Reading
More articles from the ChatGrow Team.