Blog
Chatbot Analytics: Boost Conversions & CX in 2026
By
Nelson Uzenabor
A lot of teams are in the same spot right now. The chatbot is live, conversations are happening, and leadership keeps asking the obvious question: is this thing helping, or is it just answering a few easy questions before handing the hard work back to your team?
That uncertainty is exactly why chatbot analytics matters. A bot without measurement is like hiring a support rep and never reviewing tickets, outcomes, or customer feedback. You can see activity, but you can't tell whether that activity is useful. You also can't tell whether the bot is reducing support load, creating leads, or frustrating visitors who would have converted if they'd reached a human faster.
The shift is bigger than one dashboard. The global chatbot market was estimated at USD 9.56 billion in 2025 and is projected to reach USD 41.24 billion by 2033, with a 19.6% CAGR from 2026 to 2033, according to Grand View Research's chatbot market analysis. When a category reaches that scale, analytics stops being a nice reporting feature and becomes the operating system for proving value, improving self-service, and managing performance.
In practice, strong chatbot analytics does two jobs at once. It tells the support team where conversations break down, and it tells the business whether the bot is affecting cost, pipeline, and customer experience in the right direction. That's the difference between a chatbot as a widget and a chatbot as a managed channel.
Table of Contents
Introduction Beyond Conversations to Conversions
Most chatbot programs fail for a boring reason. They measure what's easy to count instead of what matters to the business. Message volume looks busy. Session count looks reassuring. Neither tells you whether customers got answers, whether support load dropped, or whether the bot helped create revenue.
That's why I treat chatbot analytics as a report card with two audiences. Operations wants to know where the bot gets stuck. Leadership wants to know whether the channel is producing business value. If the reporting only satisfies one side, the program usually stalls.
The metric trap
A dashboard full of activity can hide weak performance. A bot can generate lots of messages because users are confused. It can have a low escalation rate because customers give up instead of asking for help. It can even look efficient while missing the intent behind the conversation entirely.
Practical rule: Don't confuse conversation volume with conversation progress.
The better lens is movement. Did the user move from question to answer, from problem to resolution, or from curiosity to qualified lead? That's the line that separates a novelty bot from an operational asset.
Why the business lens matters
As chatbot adoption expands, the amount of conversation data expands with it. That creates more opportunity, but it also raises the bar. Teams now need to prove not just that automation exists, but that it improves self-service, supports agents, and contributes to commercial goals.
Good chatbot analytics makes that visible. It connects operational signals like fallback, handoff, and flow completion to business outcomes like cost control, lead capture, and customer retention. Without that link, optimization turns into guesswork.
The Four Pillars of Chatbot Metrics
A useful chatbot analytics program is easier to manage when you stop treating it as one giant pile of data. I organize the work into four pillars: user engagement, bot performance, business impact, and user sentiment. That structure keeps teams from over-focusing on technical metrics while ignoring whether the bot is helping the company.
User engagement tells you if the bot earns attention
Engagement is the front door. If visitors don't start, continue, or complete conversations, nothing else matters.
I look at starts, repeat usage, conversation duration, bounce or drop-off, and flow completion together. One metric alone can mislead. A longer conversation isn't always better. Sometimes it means the bot is dragging a user through too many turns to reach a simple answer.
If you're refining the chat experience itself, details like greeting copy, button choices, and response pacing matter. Teams working on those early interaction patterns often benefit from studying AI chatbot design patterns for user-friendly conversations.
Bot performance shows whether the system actually works
This pillar is the engine room. It covers metrics like goal completion rate, human takeover rate, self-serve rate, and fallback rate. These aren't vanity numbers. They tell you whether the bot understood the request, kept the user on track, and resolved the issue without unnecessary friction.
Tidio reports that about 90% of customer queries are resolved in fewer than 11 messages, with an average of 11 exchanges per thread, and says businesses report about $20 million in cost savings while support teams can reduce customer service costs by up to 30% through automation, according to Tidio's chatbot statistics roundup. That's why conversation length has to be read like a productivity metric, not a popularity metric.
A short, successful conversation is usually a win. A long, circular one is often a support ticket wearing a chatbot costume.
Business outcomes connect conversations to money and efficiency
This is the pillar many teams skip, and it's the one executives care about most. A bot can look healthy inside the chat window and still fail the business. If it doesn't reduce support demand, capture lead intent, or move visitors toward purchase or booking, it's underperforming.
The key metrics here depend on your use case. Support leaders care about deflection, resolution efficiency, and what happens after a handoff. Marketing and sales teams care about lead capture, qualification, conversion rate, and which conversations produce downstream action.
A useful way to think about it is simple. Bot performance asks, “Did the machine do its job?” Business impact asks, “Did that job matter?”
User sentiment keeps optimization honest
A bot can be operationally efficient and still create a bad experience. That's where sentiment signals matter. CSAT, NPS, post-chat feedback, and conversation review help you catch issues that pure workflow metrics miss.
If flow completion rises while user feedback drops, the bot may be pushing people through a path they don't like. If handoffs fall but complaints rise, the bot may be blocking access to a human when a human is clearly needed.
Here's a simple reference view teams can use when building reports:
Metric | Pillar | What It Measures | Business Implication |
|---|---|---|---|
Conversation starts | User engagement | Whether visitors begin interacting | Indicates discoverability and initial appeal |
Drop-off or bounce | User engagement | Where users abandon the chat | Flags friction in opening flows |
Goal completion rate | Bot performance | Whether the bot helps users finish a task | Strong proxy for operational usefulness |
Fallback rate | Bot performance | How often the bot can't answer or interpret | Reveals training or knowledge gaps |
Human takeover rate | Bot performance | How often conversations require escalation | Shows limits of automation and routing quality |
Leads generated | Business impact | Whether chats create qualified demand | Connects the bot to pipeline creation |
Self-serve rate | Business impact | How often users solve issues without agents | Ties the channel to support efficiency |
CSAT or NPS | User sentiment | How users rate the experience | Prevents efficiency gains from hurting CX |
Building Your Chatbot Analytics Dashboard
The best dashboard doesn't try to show everything. It tells a story fast, then lets the team dig deeper. When I review a chatbot analytics setup, I want to know three things in order: what changed, where it changed, and why it changed.
Near the top, the dashboard should answer the executive question immediately. Is the bot resolving, escalating, or converting at the level the business expects? That summary should sit above everything else.

What leadership needs to see first
The first row should be compact and blunt. Think of it as the headline layer: overall conversation volume, goal completion, human takeover, self-serve, and leads or conversions if the bot supports sales. Leadership doesn't need a transcript-level view. They need proof that the channel is helping or a fast signal that it isn't.
Trend lines matter as much as current values. A stable number can hide a new problem if volume mix changed. A leadership panel without historical movement is like reading a scoreboard with no game clock.
What operators need for daily decisions
The second layer is for the team that manages the bot. Trends by flow, page, intent, or entry point become useful for this purpose. You should be able to see whether one support path is failing while the rest of the bot performs normally.
This layer gets stronger when the chatbot platform is tied into the rest of your customer stack. That's why many teams spend time on customer data integration for support and sales workflows. Without context from CRM, help desk, or site behavior, you can see conversations but miss the customer behind them.
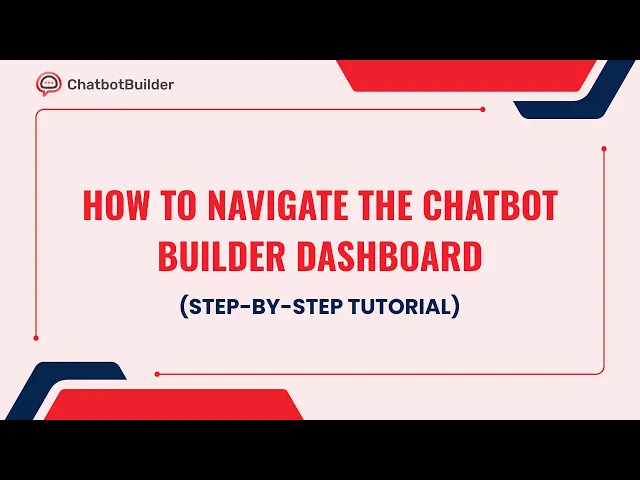
A good walkthrough of what teams expect from an analytics workspace can help sharpen your eye for layout and reporting priorities:
What drill-downs should answer
The bottom layer is where real improvement happens. Drill-down views should answer questions like these:
Which intents fail most often: This points you toward model retraining or content gaps.
Which pages produce high-value chats: This helps marketing and sales teams decide where the bot belongs.
Which handoffs are healthy versus avoidable: Some escalations are appropriate. Others mean the bot stopped one step too soon.
Which answers create repeated follow-up questions: That usually signals vague wording or incomplete guidance.
A strong dashboard works like a flight deck. The top tells you whether the aircraft is on course. The lower instruments tell you which system needs attention.
How to Interpret and Act on Your Data
A dashboard is useful only if your team knows how to read the story behind the numbers. The mistake I see most often is reacting to a metric in isolation. One number rarely explains the problem. Patterns do.
Start with the signal, not the whole dashboard
Take fallback rate. It sounds technical, but the business meaning is simple. It measures the share of messages the bot can't interpret or answer. A high fallback rate is a strong signal that the knowledge base is missing relevant content or that the intent model needs retraining on common user queries, as explained in Quickchat's guide to chatbot analytics.
That doesn't mean every fallback points to the same fix. If fallbacks cluster around one topic, you probably have a content coverage issue. If they appear across many similar phrasings of the same request, the language understanding layer may need work. If fallback is low but completion is also low, the bot may be answering confidently while still failing to move the user toward resolution.
Here's how I read common patterns:
High fallback and high handoff: The bot doesn't understand enough, so customers end up with humans.
Low fallback and low completion: The bot responds, but the flow isn't helping users finish the job.
Long conversations and rising drop-off: Users are getting stuck, not engaged.
Strong completion and weak sentiment: The workflow might be efficient but too rigid or poorly phrased.

Use a repeatable improvement loop
Teams get better results when they use the same review process every week. Not a giant quarterly overhaul. A tight loop.
Identify one problem metric
Pick the sharpest signal. Don't try to fix everything at once.Inspect transcripts and paths
Look at real conversations behind the number. Metrics tell you where. Transcripts tell you why.Write a single hypothesis
Example: users asking about refunds aren't finding the right article, so the bot falls back and escalates.Make one controlled change
Add missing content, revise routing, tighten prompts, or change the order of steps in the flow.Measure the result over time
Compare the changed path against the previous baseline. If completion rises and handoff falls without hurting feedback, keep it.
Review bot conversations the same way a good support manager reviews tickets. Don't ask only whether the reply was sent. Ask whether the issue was actually solved.
A lot of chatbot improvement is less glamorous than teams expect. It's usually better classification, cleaner content, sharper prompts, and smarter escalation rules. That's good news, because those are all fixable.
Optimizing Your ChatGrow Agent for Conversions
If your bot already handles support, the next step is getting more commercial value out of the same traffic. That doesn't mean turning every chat into a hard sell. It means using chatbot analytics to spot the moments where buying intent is already present, then reducing friction at those moments.

Play one, improve the opening move
The welcome message does more than greet users. It frames the job the bot can do. If conversations start but don't progress, the opening may be too broad, too passive, or too generic.
Test variations that map to actual buyer intent. A SaaS visitor on a pricing page needs different prompts than a customer on a help center article. For lead-focused teams building those flows, this guide to a chatbot for lead generation is useful context.
Watch for changes in conversation starts, completion of qualification steps, and whether users ask more targeted questions after the first turn. Better opening prompts often improve quality before they improve volume.
Play two, deploy where purchase intent is already high
Not every page deserves the same chatbot behavior. High-intent pages usually carry more commercial value than top-of-funnel blog traffic. Analytics helps you find where visitors are close to a decision and where a bot can remove the last bit of uncertainty.
Good candidates include pricing pages, product comparison pages, demo pages, and checkout-adjacent experiences. On those pages, the bot should do fewer things, not more. Answer objections, route complex sales questions, and capture lead details cleanly.
A broad bot on every page often creates noise. A focused bot on the right pages creates advantage.
Play three, turn failed conversations into training data
Fallbacks aren't just errors. They're demand signals. They show you what users expected the bot to handle but couldn't. That makes them one of the best inputs for improving conversion paths.
When I review fallback logs for commercial bots, I sort them into three buckets:
Missing buying information: Questions about pricing, integrations, shipping, onboarding, or contract terms.
Poor qualification logic: The bot asks for details too early, too late, or in the wrong order.
Weak escalation moments: The user is ready for a person, but the bot keeps trying to self-serve.
Failed conversations are often your clearest roadmap for what buyers still need before they say yes.
The teams that improve fastest don't hide from awkward transcripts. They mine them. That's where the best prompt changes, content additions, and escalation rules usually come from.
The Future of Chatbot Analytics
The next phase of chatbot analytics is less about counting interactions and more about proving trust and attribution. Older dashboards were built for intent-based bots that either matched correctly or failed obviously. Modern AI agents complicate that picture.
LLM quality needs deeper inspection
An LLM-powered bot can sound polished while being wrong, inconsistent, unsafe, or off-brand. That's why traditional metrics like low fallback or low handoff don't tell the whole story anymore. A fluent bad answer is still a bad answer.
More advanced teams are moving toward conversation tracing, automated evaluations, system traces, and LLM-as-a-judge workflows to inspect not just whether a response failed, but how it failed. That matters in support, lead qualification, and regulated environments where confidence without accuracy creates risk.
The practical takeaway is straightforward. If you manage an LLM-based chatbot, your quality program needs more than dashboards. It needs an evaluation loop that inspects groundedness, policy adherence, consistency, and the reasoning path behind sensitive responses.
AI traffic attribution is the next blind spot
There's another measurement problem that most chatbot reporting still misses. It's possible for an AI assistant or chatbot journey to influence site visits, assisted conversions, and downstream revenue outside the chat window. If you only measure what happens inside the conversation, you can undercount real business impact or misread it entirely.
Adobe has documented a distinct category of AI traffic in Adobe Analytics, which signals where the field is heading. Teams increasingly need to separate AI-originated or AI-assisted traffic from ordinary direct or organic behavior, then connect that traffic to onsite outcomes.
That creates a healthy tension in chatbot analytics. Operational metrics still matter. You need fallback, handoff, completion, and satisfaction to run the channel well. But advanced teams are pushing further and asking tougher questions. Did the chatbot create incremental sessions? Did it assist revenue? Did it influence the content users consumed before they converted?
Those are better questions than “How many chats did we have?” They treat the bot as part of the customer journey, not as an isolated widget.
If you want a simpler way to deploy an AI support and lead qualification agent, train it on your site content, and monitor the conversations that matter, Chatgrow is worth a look. It's built for teams that need practical automation, clean escalation, and reporting that helps turn chatbot activity into measurable customer experience and conversion outcomes.
Related Posts
Continue Reading
More articles from the ChatGrow Team.