Blog
Customer Service Analytics: Master Your Data
By
Nelson Uzenabor

89% of consumers are more likely to make another purchase after a positive customer service experience, and that one number explains why support data can't stay buried in a weekly report. McKinsey's revenue linkage is just as blunt, a 10-percentage-point increase in customer satisfaction can drive 2–3% higher revenue, and improving CX by just one point in the CX Index can generate more than $1 billion in additional revenue for large brands, as cited by Wavetec in its summary of customer experience research (Wavetec on customer experience statistics).
That's the shift in customer service analytics. It's no longer a ticket-counting exercise, it's the discipline of connecting service interactions, satisfaction, resolution, and effort to retention, repeat purchase behavior, and revenue growth. When support teams do that well, they stop reporting on what happened and start influencing what gets bought next.
Table of Contents
Why Customer Service Analytics Drives Revenue
Support used to be treated as a cost center because leaders only measured volume, backlog, and staffing pressure. That framing breaks the moment service touches revenue. If 89% of consumers are more likely to buy again after a positive service experience, support outcomes are no longer isolated from growth, they're part of the revenue engine (Wavetec).
The practical definition of customer service analytics is simple, even if the work behind it isn't. It's the systematic collection, measurement, and interpretation of customer interaction data so teams can improve satisfaction, retention, and revenue. In practice, that means analyzing pre-purchase questions, reviews, surveys, purchase histories, and post-contact outcomes, then using those signals to influence product, marketing, and sales decisions.
Practical rule: if a service metric can't change a staffing decision, a routing rule, a product fix, or a follow-up motion, it probably isn't the right metric to put on a leadership dashboard.
From support reporting to growth discipline
The historical shift matters because it changed ownership. Once teams began systematically analyzing touchpoints instead of just counting tickets, service stopped sitting at the edge of the business and started informing the core commercial loop. That's the difference between a team that answers questions and a team that shapes purchase confidence.
For founders and operators, a good framework like what is data driven decision making becomes useful. The point isn't to decorate support with analytics, it's to make decisions from evidence instead of intuition.
What makes this discipline powerful is the feedback loop. A product question from chat reveals friction on a pricing page. A review surfaces a missing detail in onboarding. A survey points to effort in returns or setup. Each signal is small on its own, but together they tell you where revenue is leaking and where trust is forming.
Core Metrics Every Support Team Should Track
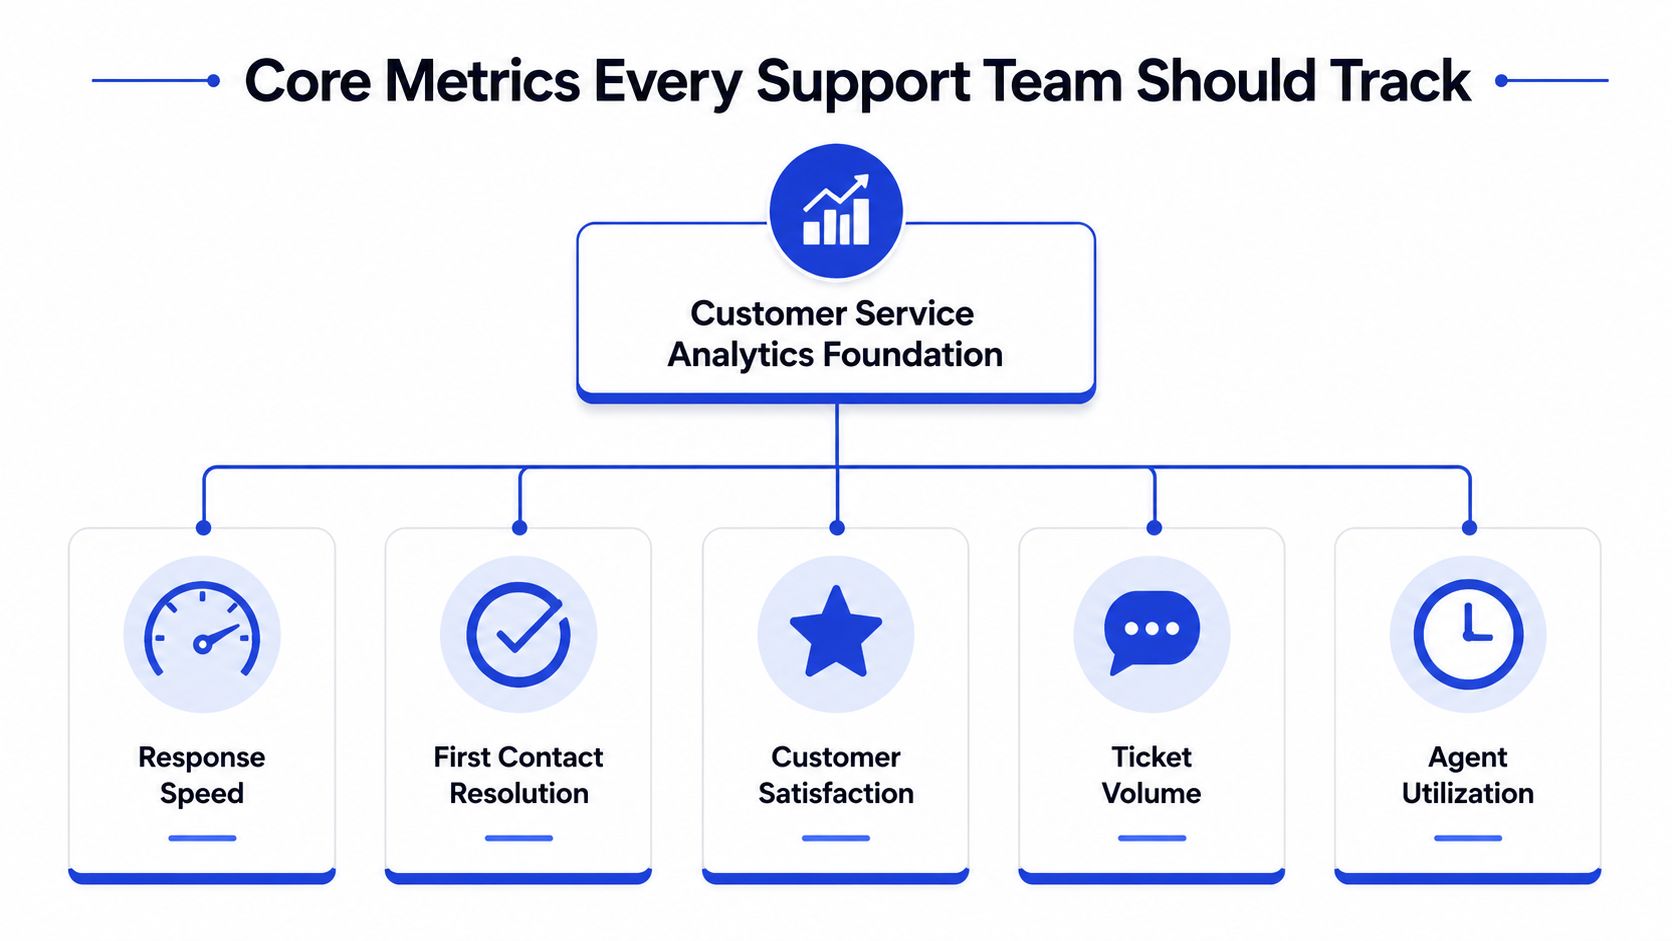
The strongest support programs don't track everything. They track a small set of high-signal metrics that move behavior. Qualtrics groups the core metrics around response speed, first contact resolution, customer satisfaction, average handle time, and abandonment rate, and that combination works because it captures speed, resolution quality, and customer effort together (Qualtrics).
Response speed tells you how quickly customers feel seen. First Contact Resolution (FCR) tells you whether the team solved the problem without forcing a repeat interaction. CSAT captures the customer's direct evaluation after the interaction. AHT shows how much time the work consumes, and abandonment rate flags where customers give up before getting help.
How the metrics connect in practice
These numbers aren't separate scorecards. Slower first response time usually raises perceived effort, even when the answer eventually arrives. Low FCR often points to weak knowledge retrieval, bad intent classification, or broken handoffs between tiers. High AHT can be healthy when the issue is complex, but it becomes a problem when agents are re-reading context because systems are fragmented.
Practical rule: don't review speed metrics without resolution metrics. Fast support that fails twice is worse than slower support that fixes the issue once.
The best operating model is a rolling baseline, not a one-time benchmark. Centralize chat, email, voice, ticket, and survey data, then compute the same definitions on a weekly cadence and review the process monthly. That keeps you from mistaking random noise for a real improvement or decline.
For teams building their metric dictionary, the internal guide on customer service KPIs is a useful reference point. The primary value comes from consistency, not from adding more numbers to the dashboard.
What to watch for across channels
Channel consistency matters because definitions drift fast. A live chat reply time shouldn't be compared with email response time as if they're the same thing, and FCR means little if one team counts a reopened ticket as resolved while another doesn't. The fix is boring but essential, use one taxonomy, one source of truth, and one set of metric definitions across every channel.
This is also why bloated dashboards fail. Too many KPIs bury the few signals that predict whether customers stay, churn, or buy again. A focused scorecard reviewed by the people who can change routing, staffing, or knowledge is far more useful than a wall of charts nobody owns.
Building Your Analytics Stack from Data to Dashboards
A useful analytics stack starts with ingestion, not visualization. Support data comes from chat, email, voice, tickets, surveys, and sometimes social mentions, and those sources rarely describe the same issue in the same format. Ever Help's guidance is right to emphasize deduplication, standardized categories, unified customer IDs, and live dashboards, because analytics quality is only as good as the entity resolution and taxonomy underneath it (Ever Help).
Build the pipeline before you build the dashboard
Start by centralizing interactions into one view. That means pulling in the raw event data, then normalizing it so one customer isn't treated as three different people across systems. If the same billing issue appears in a ticket, a transcript, and a survey comment, your stack should recognize it as one problem cluster, not three unrelated records.
From there, clean the dataset before analysis. Standard categories prevent false comparisons, and deduplication stops one issue from inflating backlog or sentiment trends. Once the structure is stable, add live dashboards that can surface spikes while the issue is still active rather than after CSAT has already fallen.
Design for intervention, not reporting
The most effective dashboards answer operational questions quickly. Is one queue spiking? Is one intent failing more often? Are sentiment scores drifting downward on a channel that normally performs well? If the answer isn't obvious within a minute or two, the dashboard is probably too broad.
A lightweight workflow helps here:
Ingest all channels: chat, email, voice, tickets, and surveys should flow into one layer.
Normalize identities: unify customer records so histories aren't split across tools.
Tag intents consistently: use the same taxonomy for issue types, even when different teams label them.
Alert on change: volume spikes, SLA misses, and sentiment shifts should trigger action before the backlog grows.
When you need a practical integration model, the internal guide on customer data integration is worth having nearby. If you're evaluating tools, Chatgrow is one option that connects support conversations, smart escalation, and lead qualification into a single operational view.
The final piece is alerting. A good support stack doesn't wait for a manager to notice a bad trend during a Friday review. It pings the team when volume jumps, when SLA misses start clustering, or when sentiment shifts in a way that suggests a product issue or a routing problem. That's the difference between reacting to damage and stopping it early.
Rethinking Metrics When AI Handles First-Line Support
AI changes what your support metrics mean. When automation answers first, a fast response no longer guarantees a good outcome, and a lower ticket count doesn't necessarily mean demand fell. Zendesk notes that modern customer analytics draws from messages, purchases, survey feedback, returns, and demographics, which is the right direction, because automation changes both the volume and the quality of interactions teams need to measure (Zendesk).
Traditional dashboards still matter, but they're incomplete if they stop at closure speed. An AI reply can deflect a ticket and still leave the underlying issue unresolved. A customer can get an immediate answer and still leave frustrated enough not to convert or return. That's why teams need to measure the combined effect of automated replies, smart escalation, and lead qualification on revenue and effort, not just ticket closure.
What changes in an omnichannel environment
The useful dimensions get broader. Track channel, language, transfer history, and escalation patterns so you can see where automation helps and where it creates friction. A customer who moves from chatbot to email to human agent is telling you something very different from a customer who gets resolved in the first exchange.
The question is no longer whether the bot answered. The question is whether the customer got to the right outcome with less effort.
That's also where AI deflection can mislead teams. If the automation closes tickets faster but hides unmet demand, the dashboard looks healthier than the business is. The right test is whether fewer handoffs, better routing, and better qualification produce better conversion, better retention, or lower effort after the first reply.
Measure the full path, not just the close
For SMBs and SaaS teams, the best lens is often the handoff. Did the AI collect enough detail for the human agent to resolve the issue faster? Did it route a sales-ready lead to the right team? Did it keep the customer moving or force them to repeat themselves? Those are revenue questions, not just support questions.
If you want a reference point for AI-heavy operations, the internal guide on AI agent monitoring is the right companion piece. And if you're comparing platform approaches, a resource like boost customer support efficiency can help frame the trade-offs around automation and escalation.
The bottom line is simple. In an AI-assisted support stack, ticket closure is a lagging indicator. Revenue impact comes from how well automation reduces effort, qualifies demand, and hands off the right context at the right moment.
Real-World Analytics Scenarios for SMBs and SaaS Teams
An e-commerce brand and a SaaS company can look at the same dashboard and make completely different decisions. That's normal. The value of customer service analytics comes from how each team uses the same signals to solve its own revenue problem.
For an e-commerce team, response speed and abandonment rate matter most during high-intent windows. If shoppers can't get a shipping or returns question answered quickly, they hesitate at checkout or abandon the conversation entirely. The useful move isn't just staffing more agents, it's watching which questions keep coming up, then improving the product page, FAQ, or post-purchase flow so the queue gets lighter over time.
E-commerce, SaaS, and AI-assisted lead handling
SaaS teams use the same data differently. FCR and escalation patterns usually reveal where the knowledge base is thin, where onboarding is confusing, or where a product workflow needs a cleaner explanation. If customers keep asking the same setup question, support is doing product education work that should probably be documented once and reused everywhere.
A small business using AI agents has a third use case. Lead qualification data plus interaction history creates a single view of intent. A visitor asking about pricing, compatibility, or implementation timing may look like support traffic on the surface, but the conversation often contains sales readiness signals that should be captured and routed fast.
Operational insight: the same chat transcript can be a support case, a product signal, and a sales opportunity, depending on who reads it and what fields get captured.
Where the fastest return usually shows up
The first return usually comes from reducing repeated work. If one question appears across multiple channels, standardize the answer and reduce human handling. If a handoff keeps losing context, capture the right details before escalation. If a lead asks for pricing and implementation timing, qualify it before the conversation disappears into a generic queue.
The important part is not using one metric to judge every business model. E-commerce teams care about conversion and repeat purchase behavior. SaaS teams care about onboarding clarity and issue resolution. AI-assisted teams care about whether automation improves both effort and revenue outcomes. The mechanics differ, but the discipline is the same, use the data to shorten the path from intent to outcome.
Common Analytics Mistakes and How to Fix Them
Most analytics programs fail subtly. The dashboard still loads, the numbers still move, and the team still feels busy, but the data no longer drives action. That usually happens because the metric set got too large, the definitions drifted, or the team started optimizing speed without checking quality.
Pitfalls and fixes side by side
Pitfall | What it looks like | Fix |
|---|---|---|
Measuring too many metrics | Leaders argue about charts, but nobody owns a change | Prioritize high-signal metrics and review them weekly |
Poor data quality | The same issue appears in different forms across tools | Establish data governance with deduplication, standard categories, and unified IDs |
Lack of clear goals | The dashboard changes every quarter without a decision rule | Define specific KPIs tied to staffing, routing, or customer outcomes |
The most common trap is the bloated scorecard. More metrics don't create clarity, they create noise. If nobody can tell which action follows a chart movement, the metric isn't doing its job.
The second trap is treating CSAT as a standalone number. Satisfaction without effort and resolution context can hide painful experiences, especially when a customer says the interaction was fine but had to repeat themselves twice. That's why the better view combines satisfaction with effort and resolution signals.
The third trap is worshipping speed. Fast replies matter, but speed at the expense of quality just moves the frustration downstream. Better to have a slightly slower queue that resolves issues cleanly than a quick queue that generates callbacks, repeat tickets, and low trust.
If you audit nothing else, audit ownership. Every metric should have a person, a definition, and an action attached to it. Without that, the dashboard is just decoration.
Your Action Plan for Better Support Analytics
If you're starting from scratch, keep the setup small. One unified dashboard, five core metrics, and a weekly review cadence will outperform a sprawling reporting stack nobody trusts. The goal is to make the numbers stable enough that the team can act on them, then refine from there.
For a newer team, the minimum viable version is straightforward. Pull support data from every active channel, normalize the customer identity, and review response speed, FCR, CSAT, AHT, and abandonment rate together. That gives you enough signal to spot routing issues, staffing gaps, and knowledge failures without drowning in data.
A practical priority list
Audit metric definitions: confirm that every channel uses the same language for response time, resolution, and satisfaction.
Consolidate sources: bring chat, email, voice, tickets, and surveys into one view before building more reports.
Set alert thresholds: watch for spikes in volume, SLA misses, and sentiment changes so issues surface early.
Review monthly: use one process review each month to decide what changed, what worked, and what still needs a fix.
For teams with a mature program, the next gains come from AI-era adjustments. Check whether deflection is hiding unresolved demand, whether smart escalation is carrying enough context, and whether lead qualification is being captured in a way sales can use. If those pieces aren't connected, you'll have efficient support and a leaky funnel.
A good rule of thumb is to keep the operational scorecard lean and the process review disciplined. Weekly monitoring catches the fire, monthly reviews change the building. That rhythm works because it respects both the speed of frontline support and the slower pace of process change.
If you want to turn support conversations into a real operating signal, visit Chatgrow and see how AI agents can handle common questions, qualify leads, and escalate the right context to your team. It's a practical way to connect customer service analytics to revenue, effort, and faster response times without adding more manual work.
Related Posts
Continue Reading
More articles from the ChatGrow Team.